Figure 160: A Gantt chart with multiple columns [src]
It is often of interest not only to show one title for a gantt bar but often one wants to show, title, start date, end date, duration or effort and so on. Up until now we have, to keep things simple only shown a single title for each activity. We will now show you how you can specify an arbitrary number of columns as titles for a Gantt chart as well as adding icons in the graph columns.
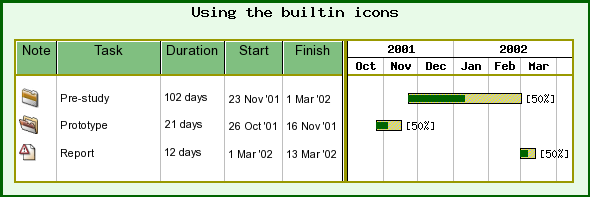
First out is an example to help visualize what we will achieve
To use multiple columns there is two steps. First you need to set the titles (name, color, fonts etc). Thereafter you need to add the title columns for each individual bar.
To set the columns you will have to work with the Activity information property of the scale. The following code excerpt show this
 $graph->scale->actinfo
->SetColTitles
(

    array('Note'
,'Task','Duration',
'Start',
'Finish'),array(
30,100));
You will notice two things. We fist specify the titles using an array. We have also specified a second array with the numbers 30 and 100. This is an optional array that specifies the minimum width of, in this case, the first two columns. By default the columns will be wide enough to hold the widest text string in the column. However for esthetic reasons you might sometimes want to increase the minium width. This is what we have done here for the first two columns.
Furthermore you can also adjust the background colors and the style and colors of the vertical dividing grid lines. In the previous image we used the lines
  $graph->
scale->actinfo->SetBackgroundColor('green:0.5@0.5');

$graph->scale->
actinfo->
SetFont(
FF_ARIAL,
FS_NORMAL,10);

$graph->scale->
actinfo->vgrid->SetStyle
('solid');

$graph->scale->
actinfo->vgrid->SetColor
('gray');
The style for the grid lines can also be "dashed", "dotted" or "longdashed" as in other line formatting contexts within the library. You can also adjust if you would like the small "3D" effect in the titles. By default this is enabled. You can easily turn this of with a call to
 $graph->scale->actinfo
->SetStyle(ACTINFO_2D);
To adjust the colors of the vertical dividing lines in the title the method SetColor() is used as in "$graph->scale->actinfo->SetColor('navy');".
The second thins is to actually populate the columns. This is done (of course) as you add the activity bars to the graph. Previous we just used a string as the title when we wasn't using columns. By simply replacing this string with an array we specify the content of the columns.
For example to specify two column titles we just create a hypothetical Gantt bar as In the full example above we put all this in arrays to make for better coding practice since we create several bars.
In addition to ordinary text you can also add an image or any of the predefined icons available. In order to add that in a column you first create an instance of IconImage() and then specify that instance instead of the text. So in the previous code snippet if we wanted a "open folder" image in the first column we would change the lines to
 $iconopen = new
IconImage(
GICON_FOLDEROPEN,
0.6);

$title2="";

$bar
= new GanttBar
(0,array($iconopen,
$title2),
"2003-11-23",
"2003-12-05");
The available builtin icons are
In addition you can also use any of you own images if you specify the argument as a string, for example
  $myicon = IconImage(
'myicon.png');
If you wonder, the second argument in the IconImage() call is an optional scaling factor which you can use to adjust the size of the image.