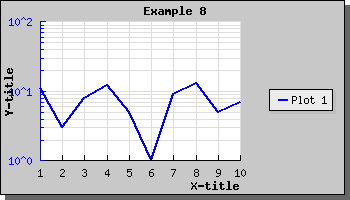
Figure 18: Enabling major and minor gridlines for Y-axis and major grid lines for the X-axis [src]
By default only the Y-axis have grid lines and then only on major ticks, i.e. ticks which have a label. It is of course possible to change this. Both the X , Y and Y2 can have grid lines. It is also possible to let the gridlines also be drawn on the minor tick marks, i.e. ticks without a label. Lets see how we can apply this to the graph above.
The grid is modified by accessing the xgrid (or ygrid) component of the graph. So to display minor grid lines for the Y graph we make the call
 $graph->ygrid->Show
(true,true)
The first parameter determines if the grid should be displayed at all and the second parameter determines whether or not the minor grid lines should be displayed.
If you also wanted the grid lines to be displayed for the Y2 axis you would call
 $graph->
y2grid->Show(true
,true)
Note. In general it is not a good idea to display both the Y and Y2 grid lines since the resulting image becomes difficult to read for a viewer.
We can also enable the X-grid lines with the call
  $graph
->xgrid->Show(
true)
In the above line we will of course only just enable the major grid lines.
To bring all this together we will display a graph with grid lines for both Y and X axis enabled.