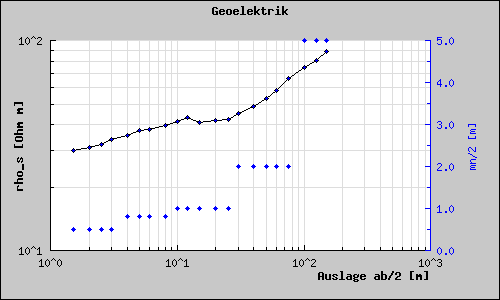
Figure 15: Using a logarithmic scale for both the Y2 axis [src]
Using a logarithmic scale requires you to include the logarithmic add on module in "jpgraph_log.php". So you must have the line
include("jpgraph_log.php"
);
on the top of your code. To Illustrate how to use a logarithmic scale let's make the right Y scale in the previous example a logarithmic scale. This is done by the line
  $graph->SetY2Scale(
"log");
This will then give the following result
You can of course also use a logarithmic X-scale as well. The following example shows this.
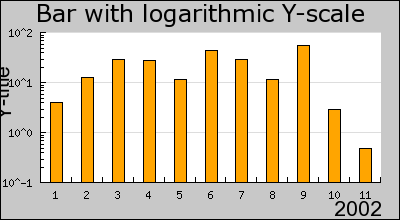
Even though we have so far only shown line graphs logarithmic scale can also be used for bar, error, scatter plots as well. Even radar plots supports the use of logarithmic plots. The following example shows how to use a logarithmic scale for a bar graph.