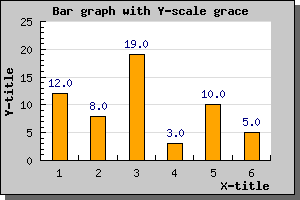
Figure 31: Showing the values for each bar [src]
You can easily choose to display the value (and it's format) on top of each bar by accessing the bar's 'value' property. So for example by just adding the line
  $barplot->value->
Show();
Will enable the values in it's simplest form and will give the result
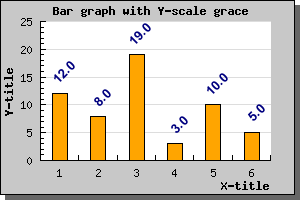
You cane see a small nuisance in this graph. The auto scaling algorithm chooses quite tight limits for the scale so that the bars just fit. Adding the value on top of the bar makes it collide with the top of the graph. To remedy this we tell the auto scaling algorithm to allow for more "grace" space at the top of the scale by using the method SetGrace() which is used to tell the scale to add a percentage (of the total scale span) more space to either one end or both ends of the scale. In this case we add 20% more space at the top to make more room for the values with the line
  $graph->yaxis->
scale->
SetGrace(20);
This will then give the graph as shown below
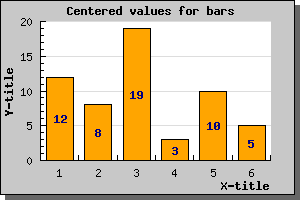
You can also adjust the general position of the value in respect to the bar by using the BarPlot::SetValuePos() method. You can set the position to either 'top' (the default) , 'center' or 'bottom'. The graph below shows the value being positioned in the center. In this example we have also adjusted the format to just display the value as an integer without any decimals.
It is also possible to specify a more fine grained control on how you want the values presented. You can for example, rotate them, change font, change color. It is also possible to adjust the actual value displayed by either using a printf()-type format string or with the more advanced technique of a format callback routine.
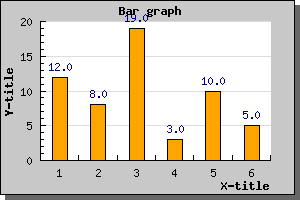
To show what you can do we just give another example for you to examine without much further explanations. Just remember that to have text at an angle other than 0 or 90 degrees we have to use TTF fonts. Even though we haven't explained the SetFont() method it should be fairly obvious.