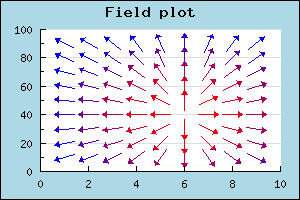
Figure 63: Example of the Field plot type [src]
A variant of scatter plot is the so called Field Plots this is basically a scatter plot where each scatter point is an arrow with a direction between 0 to 359 degrees. This effectively allows the visualization of 3 parameters at each point (x,y,angle). As an additional bonus there is also possible to define a callback for each scatter plot to also define the color for each point.
To create a field plot you create an instance of FieldPlot in the same way as you created a normal scatter plot. The arguments to this method are Y-coordinate, X-coordinate and angle. To specify a callback you use FieldPlot::SetCallback()
The following example (and code) illustrates the usage of the field plot type.
In addition to the parameters mentioned above you can also adjust both the general size of the arrow and also the specific size of the arrowhead. The arrow size is specified in pixels and the arrow head is specified as an integers between 0 and 10. These sizes are specified with a call to FieldPlot::arrow::SetSize()