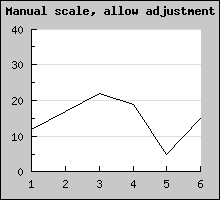
Figure 72: Manual scale, manual ticks major=7 minor=2 [src]
Normally the automatic scaling should be doing an adequate job in most circumstances but there might be cases where you like to manually set the scale. For example if you have several graphs where you like to be able to easily compare them and therefore want them all to have the same scale.
To specify a manual scale you have to add arguments to the standard Graph::SetScale() method. So to specify that you want an Y-scale between 0 and 100 you need to write
 $graph->
SetScale(
"textlin",0,100
);
When you specify a scale manually there is one additional thing you need to decide. How the tick marks should be positioned. You have three choices
  $graph->SetScale(
"textlin",0,100
);

$graph->yscale->
ticks->Set(10
,5);
Will set the major tick marks every at 0,10,20,.. And every minor tick mark in between (0,5,10,15,20,25,...).
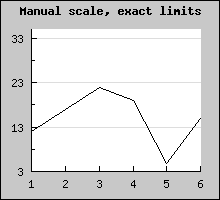
The three images below illustrates the difference between the possibilities of ticks for a manual scale.