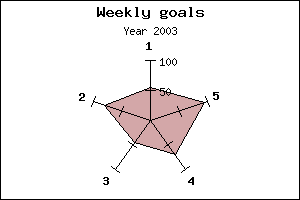
Figure 111: A first very simple radar plot using default settings [src]
Let's start by creating a very simple radar plot based on 5 data points using mostly default values.
As the first thing you must remember to include the extension module that contains the radar plot. "jpgraph_radar.php".
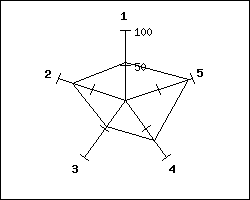
A very simple radar plot is created by the code
 <?php

include (
"../jpgraph.php");

include ("../jpgraph_radar.php");


// Some data to plot

$data
= array(55,80,
46,71,95
);


// Create the graph and the plot

$graph
= new RadarGraph
(250,200,
"auto");

$plot
= new RadarPlot
($data);


// Add the plot and display the graph

$graph->Add(
$plot);

$graph->Stroke();

?>
and would give the result
To change the size and position of the radar graph is similar to the pie plot and you do it by using the methods SetSize() and SetCenter()
If you want a filled radar plot you need to specify the fill color with the method SetFillColor() The following example shows these methods in action