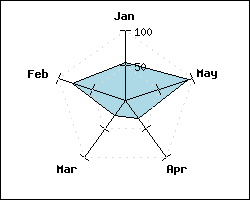
Figure 113: Adding dotted gridlines to the graph [src]
Each major tick mark can also be connected together to create a grid. The grid is accessed through the 'grid' property of the graph. To enable the grid and set the line style to "dotted" you would have to add the lines
 $graph->grid->Show
();

$graph->grid->
SetLineStyle(
"dotted");
and would result in the following graph
By design the plot is above the grid line but beneath the axis in image depth, hence some part of the grid lines are hidden.
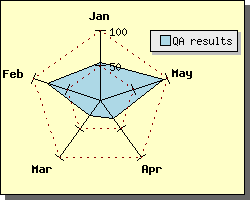
To have the grid lines more "visible" just change their color, say to, dark red by invoking the SetColor() method on the grid lines which would give the following result
Another simple change we could do would be to just change the background color of the radar graph. This is (not surprisingly) done by a call to the method SetColor() invoked on the graph object.