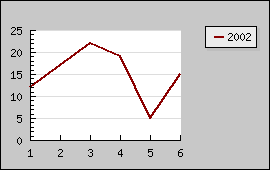
Figure 172: Original image [src]
JpGraph provide the possibility for you to rotate the generated graph an arbitrary angle. This will only affect the actual graph (axis, axis titles, labels and so on) and not fixed elements on the graph like title or footer.
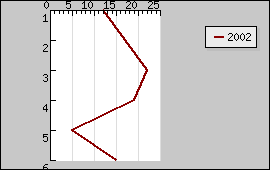
Rotation is probably most used to rotate a graph 90 degrees, for example a bar graph to get the effect of horizontal bars.
Performance note: Adding a rotation transformation will make the graph generation slightly slower since each point of the graph as to go through a transformation step before being stroked on to the image. JpGraph optimizes this by using a pre-calculated transformation matric and also optimizes the special case 90 degrees.
By default the center of the rotation will be the center of the plot area, which may or may not coincide with the center of the entire image.
To control the rotation you use the two methods
For example
 $graph->image->SetAngle
(45);
There is actually a third method that you could use, adding a translation to the graph after the rotation. Since this probably a very little used method we don't discuss it further but refer the reader to the class reference instead Graph:image::SetTranslation()
When you rotate an image you should be aware of that the individual
labels on the axis are not rotated. The design decision behind this is
a) Bit mapped font can't be rotated
b) Maintain readability
Please remember that you may still rotate the labels by calling the Axis::SetLabelAngle() method.
Since the anchor point for labels is by default the optimum for graph at 0 degree you might want to adjust the anchor point and alignment for the labels on the axis to get a better visual appearance on you rotated graph. This is accomplished by the method Axis::SetLabelAlign() For a detailed discussion on how to do this please see the section on horizontal bar graphs, ( Working with bar plots )
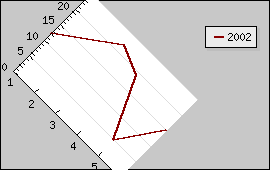
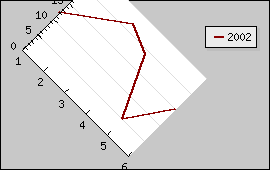
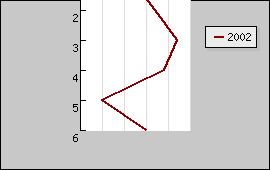
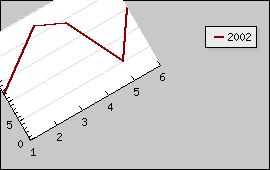
The table below shows some examples on different kinds of rotation to give you an idea of how changing the angle and rotation center may be used to generate different effects. The top left graph is the original image. The point of rotation has been marked with a red-cross in each of the images.
As you can see from the images above if you rotate about any other point than the center of the plot area the plot can be placed outside the image after rotation.
Since the rotation, by design, only affects the plot area it is often most effective to use when the color of the margin is the same as the background color.