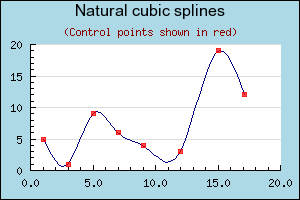
Figure 26: Using spline to get a smooth curve between the control points. [src]
If you only have access to a few data points but still want a smooth curve between those data points JpGraph can help you achieving that by letting you construct cubic splines. If you never have heard of cubic splines before, don't worry. You only have to supply the data points you know tell JpGraph how many interpolated points in total you want in the graph. JpGraph will now take care of constructing a smooth curve between all you data points. The new, smooth, curve will be made up of exactly as many interpolated points as you have specified.
To construct a spline you need both the X and Y coordinates for the known data points.
You start by constructing a new Spline instance. To get access to the Spline class you must first remember to include the file "jpgraph_regstat.php". You instantiate this class by calling it with your two known data arrays (X and Y) as follows.
  $spline
= new Spline($xdata,
$ydata);
This call initializes the spline with the data points you have. These data points are also known as Control points for the spline. This helper class doesn't draw any line itself. Instead it is merely used to get a new (larger) data array which have all the interpolated values. You then use these new value in your plot. This way give you great flexibility in how you want to use this interpolated data.
Continuing the above line we now use the Spline::Get() method to get an interpolated array containing a specified number of points. So for example the line
  list(
$sdatax,
$sdatay) =
$spline->Get(50
);
Will construct the two new data arrays '$sdatax' and '$sdatay' which contains 50 data points. These two arrays are constructed from the control point we specified when we created the '$spline' object.
You would then use these two new data array in exactly the same way as you would form ordinary data vectors.
The following example illustrates this
In order to make the example more interesting we actually use two plots. First a line plot to get the smooth curve and then a standard scatter plot which is used to illustrate where the control points are.