Figure 25: Accumulated filled line graph [src]
Accumulated line graphs are line graphs that are "stacked" on top of each other. That is, the values in the supplied data for the Y-axis is not the absolute value but rather the relative value from graph below. For example if you have two line graphs with three points each, say [3,7,5] and [6,9,7]. The first graph will be plotted on the absolute Y-values [3,7,5] the second plot will be plotted at [3+6, 7+9, 5+7], hence the values of the previous graphs will be used as offsets.
You may add any number of ordinary line graphs together. If you want to use three line plots in an accumulated line plot graph you write the following code
 // First create the individual plots

$p1 = new LinePlot(
$datay_1);

$p2 = new LinePlot(
$datay_2);

$p3 = new LinePlot(
$datay_3);


// Then add them together to form a accumulated plot

$ap = new AccLinePlot(array($p1,
$p2,$p3));


// Add the accumulated line plot to the graph

$graph->Add(
$ap);
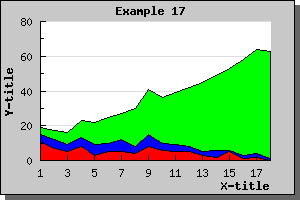
You might of course also fill each line plot by adding the lines
  $p1
->SetFillColor
("red");

$p2->SetFillColor(
"blue");

$p3->SetFillColor(
"green");
Using some appropriate data this might then give a graph perhaps like the one showed in the figure below