Figure 23: Filled line graph with plot marks [src]
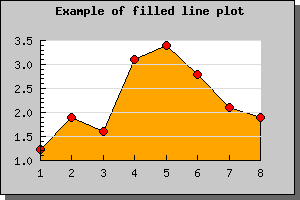
Using a filled line plot is not much different from using a normal line plot, in fact the only difference is that you must call the method SetFillColor() on a normal line plot. This will then fill the area under the line graph with the chosen color.
In the example below we have also, as an example, specified plot marks (see previous sections).
Note 1. If you add multiple filled line plots to one graph make sure you add the one with the highest Y-values first since it will otherwise overwrite the other plots and they will not be visible. Plots are stroked in the order they are added to the graph, so the graph you want front-most must be added last.
Note 2. When using legends with filled line plot the legend will show the fill color and not the bounding line color.
Note 3. Filled line plots is only supposed to be used with positive values. Filling line plots which have negative data values will probably not have the appearance you expect.
As you can see from the graph above the grid lines are below the filled line graph. If you want the grid lines in front of the graph you can adjust the depth with call to Graph::SetGridDepth() As the following example shows