Figure 21: Just printing every second label on the X-axis [src]
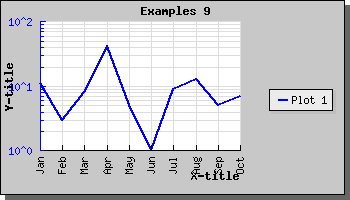
As can be seen in the previous example the X-axis is slightly cluttered with the labels very close to each other. We might rectify this by either enlarging the image or just displaying fewer tick label on the x-axis.
Specifying that we only want, for example, to print every second label on the axis is done by a call to the method SetTextLabelInterval() Which would result in the graph
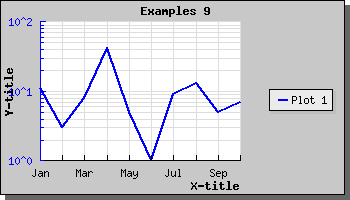
If the text labels are long (for example full dates) then another way might be to adjust the angle of the text. We could for example choose to rotate the labels on the X-axis by 90 degrees. With the help of the SetLabelAngle()
Which would then result in the image below