Figure 3: A simple line graph [src]
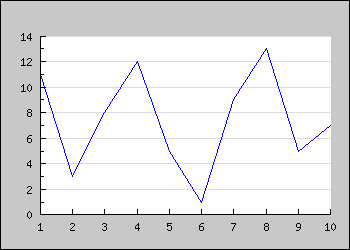
The first example draws a line graph consisting of 10 Y-values. In this first example we show the full code. In the following examples we will only show interesting piece of the code.
 <?php

include (
"../jpgraph.php");

include ("../jpgraph_line.php");


// Some data

$ydata
= array(11,3,
8,12,5
,1,9,
13,5,7
);


// Create the graph. These two calls are always required

$graph
= new Graph(350,
250,"auto");

$graph->SetScale(
"textlin");


// Create the linear plot

$lineplot
=new LinePlot($ydata);

$lineplot
->SetColor("blue");


// Add the plot to the graph

$graph->Add(
$lineplot);


// Display the graph

$graph->Stroke();

?>
You might note a few things
This is a perfect fine graph but looks a little bit "sparse". To make it more interesting we might want to add a few things like
From looking at the previous example you can see that you access all properties of JpGraph through the objects you create. Graph(), LinePlot() and so on. In general all objects you can see in the graph is accessed through a named instance.
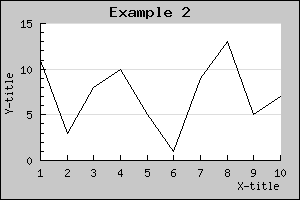
For example the title of the graph is accessed through the 'Graph::title' property. So to specify a title string you make a call to the 'Set()' method on the title property as in:
 $graph->title->Set
('Example 2');
So by adding just a few more lines to the previous code we get a graph as shown below.
To achieve this we just needed to add a few more lines. (We only show the part of example 1 we changed, to look at the full source just click the [src] link in the caption. )
// Setup margin and titles

$graph->img->
SetMargin(40,20
,20,40);

$graph->title->
Set(
"Example 2");

$graph->xaxis->
title->Set("X-title"
);

$graph->yaxis->
title->Set("Y-title"
);
Again there are a couple of things you should note here
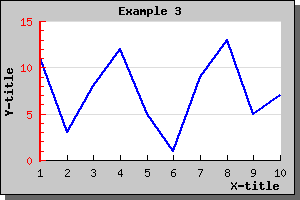
A nice change would now be to have all the titles in a bold font and the line plot a little bit thicker and in blue color. Let's do that by adding the lines
  $graph->
title->SetFont(FF_FONT1
,FS_BOLD);

$graph->yaxis->
title->SetFont(FF_FONT1
,FS_BOLD);

$graph->xaxis->
title->SetFont(FF_FONT1
,FS_BOLD);

$lineplot
->SetColor("blue");

$lineplot
->SetWeight(2);
// Two pixel wide
Again please note the consistent interface. To change font you just have to invoke the SetFont() method on the appropriate object. This principle is true for most methods you will learn. The methods may be applied to a variety of objects in JpGraph. So for example it might not come as a big surprise that to have the Y-axis in red you have to say:
 $graph->yaxis->SetColor
("red")
or perhaps we also want to make the Y-axis a bit wider by
  $graph
->yaxis->SetWidth(
2)
As a final touch let's add a frame and a drop shadow around the image since this is by default turned off. This is done with
  $graph
->SetShadow()
The result of all these modifications are shown below.