Figure 6: Adding markers to the previous example [src]
It might sometimes be desirable to highlight the data-points with marks in the intersection between the given x and Y-coordinates. This is accomplished by specifying the wanted plot mark type for the "mark" property of the line graph. A full list of all available marks is given in the class reference PlotMarks
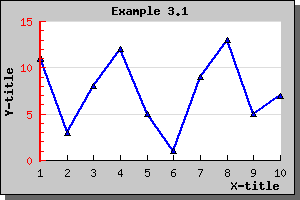
For now let's just add a triangle shape marker to our previous graph by adding the line
  $lineplot->
mark->SetType(MARK_UTRIANGLE
);
This will give the graph as shown below
If you like you can of course both change the size, fill-color and frame color of the chosen plot mark.
The colors of the marks will, if you don't specify them explicitly, follow the line color. Please note that if you want different colors for the marks and the line the call to SetColor() for the marks must be done after the call to the line since the marks color will always be reset to the lines color when you set the line.