Figure 7: Displaying the value for each data point [src]
As a final easy modification we can enable the display of the data value above each data point. The value is represented by the 'value' property in the plot. (You can read more about the possibilities of the display value in the class reference.)
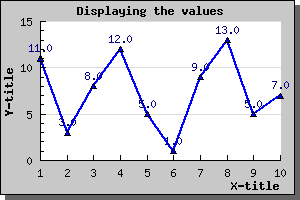
To enable the display of the value you just need to call the Show() method of the value as in
  $lineplot->value->
Show()
Adding that line to the previous line plot would give the result shown below.
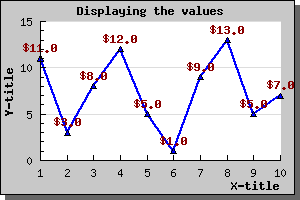
We can of course change both color, font and format of the displayed value. So for example if we wanted the display values to be dark red, use a bold font and have a '$' in front we need to add the lines
  $lineplot->value
->SetColor("darkred");

$lineplot
->value->SetFont(
FF_FONT1,
FS_BOLD);

$lineplot
->value->SetFormat(
"$ %0.1f");
This would then result in the following image