Figure 9: Adding a second plot to the previous graph [src]
What if we want to add a second plot to the graph we just produced? Well, this is quite straightforward and just requires two simple step:
To create the second plot we need some data (we could of course use the same data as for the first plot but then we wouldn't be able to see the new plot!)
The following lines show how to create the new plot and add it to the graph (we only show the new lines - not the full script)
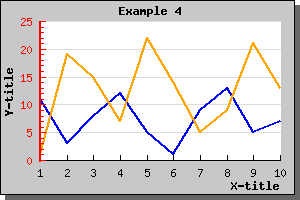
  $ydata2
= array(1,19,
15,7,22
,14,5,
9,21,13
);

$lineplot2
=new LinePlot($ydata2);

$lineplot2
->SetColor("orange");

$lineplot2
->SetWeight(2);


$graph->Add(
$lineplot2);
Making these changes to the previous graph script would generate a new graph as illustrated below.
There is a few things worth noting here