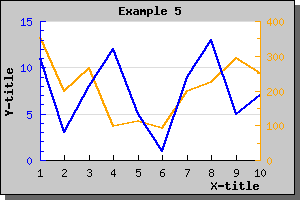
Figure 10: Adding a second Y-scale plot to the same graph [src]
As you saw in the preceding example you could add multiple plots to the same graph and Y-axis. However what if the two plots you want to display in the graph has very different ranges. One might for example have Y-values like above but the other might have Y-values in the 100:s. Even though it is perfectly possible to add them as above the graph with the smallest values will have a very low dynamic range since the scale must accomplish the bigger dynamic range of the second plot.
The solution to this is to use a second Y-axis with a different scale and add the second plot to this Y-axis instead. Let's take a look at how that is accomplished.
First we need to create a new data array with large values and secondly we need to specify a scale for the Y2 axis. This is done by the lines
 $y2data = array(
354,200,265
,99,111,
91,198,225
,293,251);

$graph->SetY2Scale(
"lin");
and finally we create a new line plot and add that to the second Y-axis. Note that we here use a new method, AddY2(), since we want this plot to be added to the second Y-axis. Note that JpGraph will only support two different Y-axis. This is not considered a limitation since using more than two scales in the same graph would make it very difficult to interpret the meaning of the graph.
To make the graph a little bit more esthetic pleasing we use different colors for the different plots and let the two different Y-axis get the same colors as the plots.
The resulting graph is shown below. source)