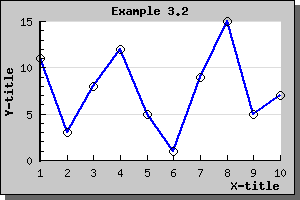
Figure 96: A typical graph with autoscaling and grace=0 [src]
By default the auto-scaling algorithm tries to make best possible use of screen estate by making the scale as large as possible, i.e. the extreme values (min/max) will be on the top and bottom of the scale if they happen to fall on a scale-tick. So for example doing a simple line plot could look like the plot shown in the below.
However you might sometime want to add some extra to the minimum and maximum values so that there is some "air" in the graph between the end of the scale values and the extreme points in the graphs. This can be done by adding a "grace" percentage to the scale. So for example adding 10% to the y-scale in the image above is done by calling the SetGrace() method on the yscale as in
 $graph->yaxis->scale
->SetGrace(10,
10);
These lines add a minimum of 10% to the top and bottom values of the scale. Note that we say "minimum" since depending on the specific tick values choose this might be a little bit more to make the end of the scale fall on an even tick mark.
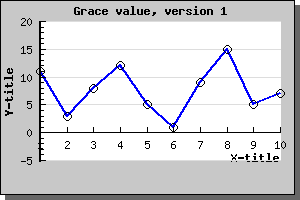
Adding this line to the previous graph will result in the following example
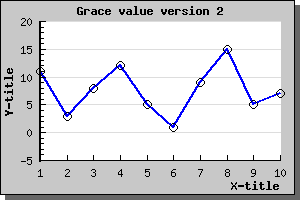
Since we haven't adjusted the position of the X-axis it will remain at Y=0 which might not necessary be what we would like so we therefor also add the line
 $graph->xaxis->SetPos
("min");
So that the X-axis always will remain at the lowest possible Y-value. Doing this will then result in the example below