As an additional way of emphasizing certain areas of the graph it is possible to add bands (either vertical or horizontal) to any one of the standard X-Y coordinate system based graphs. A band is a rectangular area that stretches one entire axis. This means that if you define a band between X-coordinates 3 and 5 the band area will occupy an area between the X-coordinates and the entire Y-range.
In order to access this functionality you must first make sure that you include the additional library file jpgraph_plotband.php
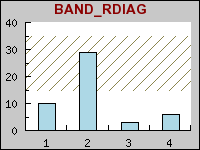
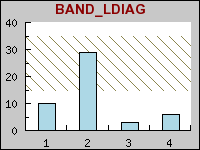
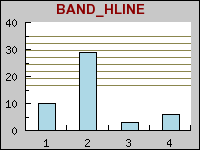
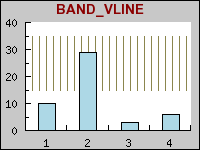
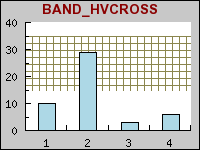
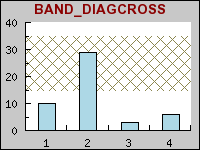
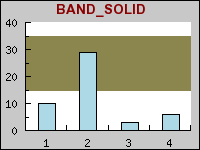
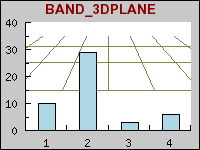
At the time of this writing (current as of JpGraph 1.8) the table below illustrates the 8 basic types of patterns available. We will shortly show you how you can customize these patterns, To keep these examples clear we have only used one pattern in each figure.
To add a one of these patterns to your graph you need to call the method PlotBand::PlotBand() The arguments is fairly easy to understand. The pattern you would like to use is specified by using the correct constant. You can see the name of the correct constants in the figures above. You also need to specify if the band should stretch along the vertical or horizontal axis as well as the min and max coordinates for the band. As coordinates you may also use the special values "min" and "max" which automatically sets the value to the minimum/maximum value of the scale. The specified numeric value will be automatically truncated to fit within the plot area.
We don't discuss the other arguments further here, instead we refer you to the class reference.