Figure 36: A grouped bar plot [src]
These types of bar graph is used to easy group two or more bars together around each tick (X-value). The bars will be placed immediately beside each other and as a group centered on each tick mark. A grouped bar is created by aggregating two or more ordinary bar graphs and creating a GroupBarPlot() From two ordinary bar graphs along the lines of
// Create the bar plots

$b1plot
= new BarPlot($data1y);

$b1plot->SetFillColor(
"orange");


$b2plot
= new BarPlot($data2y);

$b2plot->SetFillColor(
"blue");


// Create the grouped bar plot

$gbplot
= new GroupBarPlot
(array($b1plot
,$b2plot));


// ...and add it to the graPH

$graph->Add(
$gbplot);
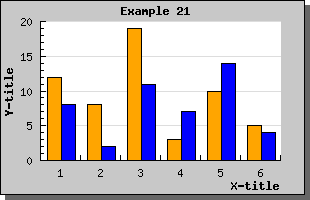
The following example illustrates this type of graph
There is no limit on the number of plots you may group together.
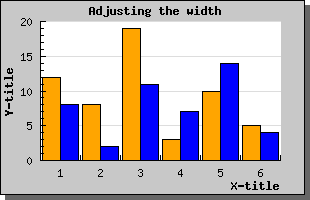
If you use the SetWidth() method on the GroupBarPlot() this will affect the total width used by all the added plots. Each individual bar width will be the same for all added bars. The default width for grouped bar is 70%.
Setting the grouped with to 0.9 would result in the image below.