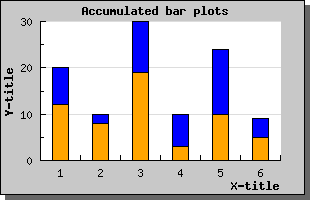
Figure 38: Accumulated bar plots [src]
The final variety of group bars you can have are accumulated bars. They work in much the same way as accumulated line plots described above. Each plot is stacked on top of each other.
You create accumulated bar plots in the same way as grouped bar plots by first creating a number of ordinary bar plots that are then aggregated with a call to AccBarPlot();
An example makes this clear. Let's use the same data as in the two examples above but instead of grouping the bars we accumulate (or stack) them. The code would be very similar (actually only one line has to change)