Figure 55: Linear error plot [src]
A line error plot is an error plot with the addition that a line is drawn between the average value of each error pair. You use this type of plot the exact same way you would use an error plot. The only change is that you must instantiated an ErrorLinePlot() instead and make sure you have included the "jpgraph_line.php" since the line error plot makes use of the line plot class to stroke the line.
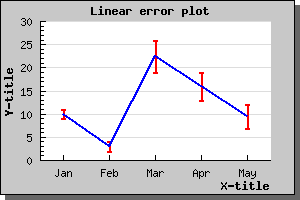
To control the various properties of the line drawn the "line" property of the error line plot may be accessed. So, for example, if you want the line to be 2 pixels wide and blue you would have to add the following two lines
  $elplot->line->
SetWeight(2);

$elplot->line->
SetColor(
"blue");
to generate the graph as shown below
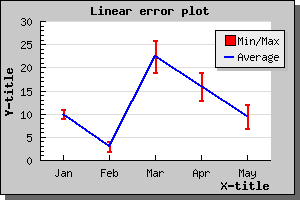
You may of course add legends to none, one or both of the line types in the above graph. So for example if we wanted the legend "Min/Max" for the red error bars and a legend "Average" for the blue line you would have to add the lines
  $errplot->SetLegend(
"Min/Max");

$errplot->line->
SetLegend(
"Average");
The resulting graph will now look like (note that we are using the default placement of the legend box)