Figure 53: A simple error bar [src]
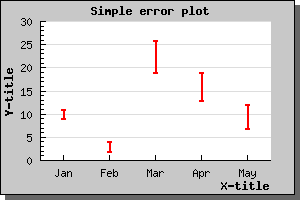
Error plots are used to visually indicate uncertainty in data points. This is done by for each X value by giving both a minimum and a maximum Y-value.
Before you can use error plots you must remember to include the file "jpgraph_error.php" in your script.
The following example illustrates a simple error bar. We will have 5 points, so we need 10 Y-values. We also would like the error bars to be red and 2 pixels wide. All this is accomplished by creating an ErrorPlot() in much the same way as, for example, a normal line plot. Doing this would now give the example shown below.
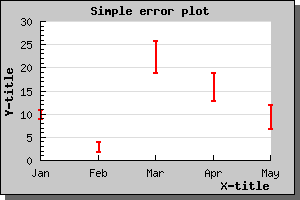
You might notice that there is one displeasing esthetic quality of this graph. The X-scale is just wide enough to just accompany the number of error bars and hence the first bar is drawn on the Y-axis and the and last bar just at the edge of the plot area. To adjust this you might call the SetCenter() method which will adjust the X-scale so it does not use the full width of the X-axis.
The following example illustrates the use of this feature by applying this technique to the previous example