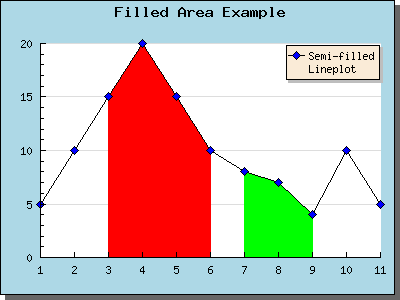
Figure 52: Semi-filled line graph [src]
Semi filled bar graphs are in principle the same as normal filled bar graphs but with the additional feature that you can choose to only fill a specified range (or ranges) of X-coordinates. The figure below illustrates this
In this example we defined two areas along the X-axis to be filled. You can add filled areas by using the method AddArea() and specifying range and color for the filled area.