Figure 64: A simple stock plot [src]
Stock charts is used to display data values where one is interested in 4 different values for each data point. This could for example be used to display a stocks open,close, min and max value during a specific day. Hence the name Stock chart (or Stock plot).
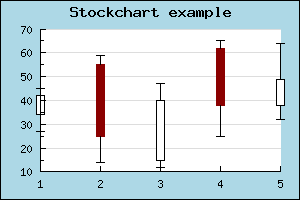
The figure below illustrates a sample Stock chart plot
For this type of plot the Y-data array must be consist of a number of quadruples of data where each quadruple consists of (open,close,min,max). The open and close values determine the min max for the middle bar and the min,max determine the end points of the "error-lines" at the top and bottom of of each bar.
Note that the data follows the following rules
To separate the two cases where "open > close" or "open < close " different colors are used. These colors are specified with the SetColor() method. By default a positive bar (close > open) have a fill color of white and for the negative case where (close < open) the bars have a red color.
You can specify the width of the bar by setting the width (in pixels) with a call to the method SetWidth()
The final variation of stock plots you can have is to determine whether or not the end point for the min,max lines should have the horizontal line marking the end of the line or not. This can be adjusted with a call to method HideEndLine().