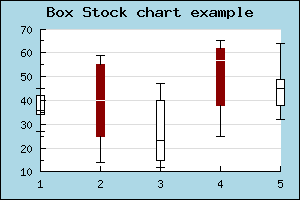
Figure 65: A simple box type stock plot [src]
A minor variation of stock charts is the "BoxPlot()" this is almost the same as StockPlot() but with the very small difference that in addition to the open,close,min, max values you also specify a median value . The median lies between the open and close value and is illustrated as a horizontal line within the bar.
You may modify the median line color for positive and negative data points / bars by using the SetMedianColor() method.