Figure 135: A simple 360 degree polar graph [src]
Each data point in a polar plot is represented by a tuple consisting of a radius and an angle. The polar plot itself can be either outlined or filled. In addition each point may have a standard marker (the same as for line and scatter plots).
The scale for the radius can be either linear or logarithmic.
A polar graph is created by creating an instance of PolarGraph::PolarGraph(). The polar graph type inherits all the capabilities of ordinary X-Y graphs, i.e they can have background images, background gradients, tabbed titles and so on.
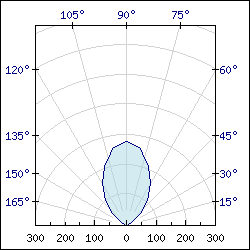
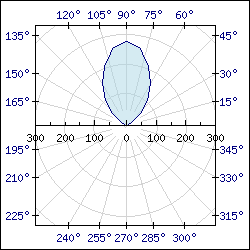
Polar graphs comes in two basic types, they can either show a full 360 degree graph or a half 180 degree graph. The two examples below show these two basic types of graphs.