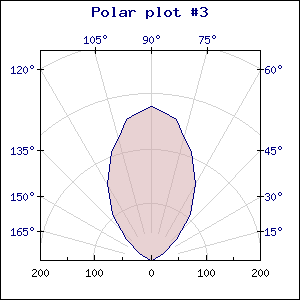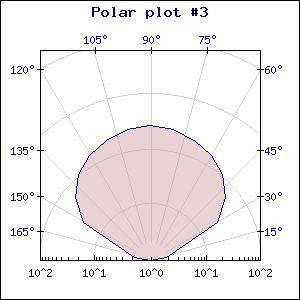
Figure 137: Using a logarithmic scale [src]
The radius axis can be shown in either a linear or logarithmic scale. This is controlled, as usual, by a call to PolarGraph::SetScale() The two examples below show the same plot in either linear or logarithmic scale
Please note that the maximum values of the scales are different.
By default the scale will be auto scaled depending on the data. You can also specify a manual scale by supplying an extra argument to the SetScale() value. The only difference from the manual scaling with the other X-Y-graphs is that for polar graph you only specify a manual maximum. The minimum will always be 0 for the linear scale and a scaled value of 10 (i.e 1, 0.1, 0.001 and so on) for the logarithmic scale.
The plot is clipped to the plot area so if you specify a smaller scale then the maximum value that part of the plot that are outside the plot area will be clipped.