Figure 78: Example on how to format an axis to hold a date/time scale using and integer scale and a callback routine [src]
In the following we will assume that all data points are specified by a tuple where the date/time is specified as a timestamp in second in the same format as is returned by the PHP function time().
The trick here is to use a label formatting callback routine which gets called to format each label on the scale.
What we do is that we specify that the X-scale should be an ordinary "int" scale (remember that the data values are timestamps which are integers). We then install our custom label callback (with a call to SetLabelFormatCallback()) which given a timestamp formats it to a suitable human readable form. In our example we will use the PHP function Date() for this purpose.
The callback we use will be
// The callback that converts timestamp to minutes and seconds
function
TimeCallback(
$aVal) {
return Date
('H:i:s',$aVal);
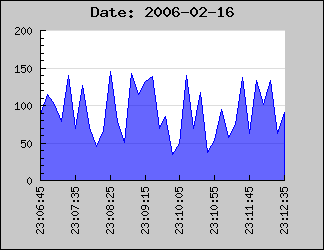
}Using some random data we can now generate the following graph
In the above example we have specified the X-scale manually to make sure that the min/max values on the X-axis exactly matches the min/max x-data values.
SetLabelFormatCallback() will be called for each of the displayed labels and the argument passed on to the supplied function is the default label that the library is assigning that specific label.
This means that if the data to be displayed is based on, for example, timestamps which are given in seconds the displayed value might not be aligned to how time/date values normally should be displayed.
Using integer scales this will not work very well since the library determines label positions to be at even positions (e.g. every 2,5,10, 20,50,100 etc) to suit the auto-scaling since the library will assume that the data is integers and not timestamp values.
The best way to solve this is to use an integer X-scale together with a a callback function with a manually specified scale. In order to setup the scale a bit of manually work is needed. Depending on the data to be displayed one should ensure that the scale starts and ends at suitable times and that the tick interval chosen fits with an even multiple of minutes, hours, days or what is best suited for the time range that is to be displayed.
The following code example illustrates this. It creates some "fake" data that is assumed to be sampled time based data and sets up some suitable scales and tick interval. This script may be used as a basis for more advanced handling of the time data.
 <?php


// Example on how to treat and format timestamp as human readable labels

require_once(
"../jpgraph.php");

require_once("../jpgraph_line.php");


// Number of "fake" data points

DEFINE('NDATAPOINTS',
500);


// Assume data points are sample every 10th second

DEFINE('SAMPLERATE',
10);


// Callback formatting function for the X-scale to convert timestamps

// to hour and minutes.

function
TimeCallback(
$aVal) {

    return Date
('H:i', $aVal);

}


// Get start time

$start = time();


// Set the start time to be on the closest minute just before the "start" timestamp

$adjstart
= floor($start /
60);


// Create a data set in range (20,100) and X-positions


// We also apply a simple low pass filter on the data to make it less

// random and a little smoother

$data
= array();

$xdata
= array();

$data[0] =
rand(20,100
);

$xdata[0] =
$adjstart;

for( $i=1;
$i <
NDATAPOINTS; ++
$i ) {

    $data[$i] =
rand(20,100
)*0.2 + $data[
$i-1]*0.8
;

    $xdata
[$i] = $adjstart +
$i *
SAMPLERATE;

}


// Assume that the data points represents data that is sampled every 10s

// when determing the end value on the scale. We also add some extra

// length to end on an even label tick.

$adjend = $adjstart  + (
NDATAPOINTS+10)*10
;


$graph
= new Graph(500,
250);

$graph->SetMargin(
40,20,30
,50);


// Now specify the X-scale explicit but let the Y-scale be auto-scaled

$graph->SetScale(
"intlin",0,0
,$adjstart,$adjend);

$graph->title->
Set(
"Example on TimeStamp Callback");


// Setup the callback and adjust the angle of the labels

$graph->xaxis->
SetLabelFormatCallback(
'TimeCallback');

$graph->xaxis->
SetLabelAngle(
90);


// Set the labels every 5min (i.e. 300seconds) and minor ticks every minute

$graph->xaxis->
scale->ticks->Set
(300,60);


$line
= new LinePlot
($data,$xdata);

$line->SetColor(
'lightblue');

$graph->Add(
$line);


$graph->Stroke();

?>